
BANK5 2026-5YR23 is a $1.2 billion five-year conduit deal backed by 33 loans, with above-average concentrations in the office and mixed-use sectors. The pool's better-than-average diversification statistics are somewhat offset by its credit profile. Top-10 concentration is below the peer average and the effective loan count is higher than peer deals, but the pool carries a pronounced office overweight, elevated balloon leverage, a large share of low-DSCR and low-debt-yield loans, and near-zero sponsor cash equity. Loan-level review of three larger exposures returns mixed verdicts in each case, with the narratives relying on lease-up assumptions, tax-abatement execution, and hospitality occupancy trends. Application of an office stress scenario to our cashflow engine reveals the potential for losses reaching into Class D, leaving Class C money-good.
Composition and Credit
-
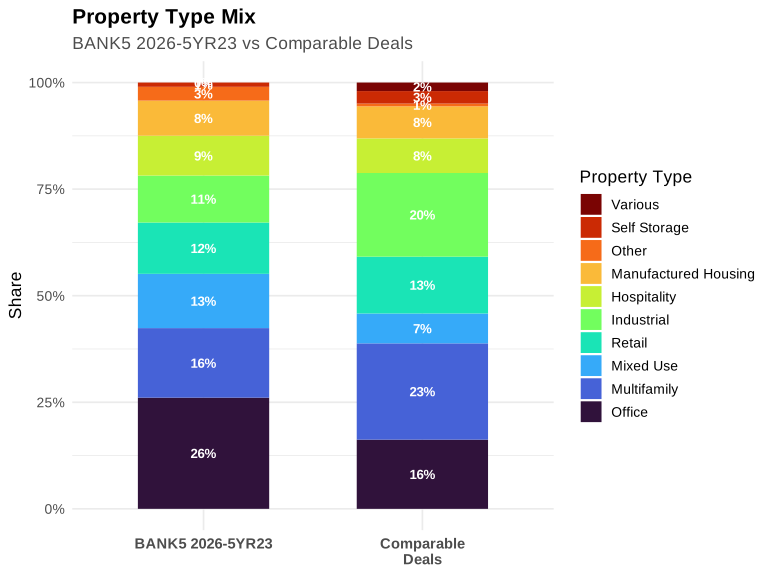
Office overweight is the defining collateral risk: Office represents 26.1% of the pool versus a 13.8% peer average — nearly double — making it the single largest property-type deviation in the comp set. Mixed-use adds a further 12.7% versus 5.6% for peers, compounding exposure to income streams that are often partially office-dependent.
-
Industrial and multifamily are meaningfully underweight: Industrial stands at 11.0% versus a 21.8% peer average, and multifamily at 16.3% versus 24.2% — the two property types that have demonstrated the most durable cash-flow resilience in recent vintage conduits are both below-weight here.
-
Hospitality is modestly above peer average: At 9.4% versus 7.8%, hospitality is a secondary overweight; not a dominant concern on its own, but it adds to the pool's cyclical tilt alongside office.
- California concentration is the primary geographic risk: At 25.4% versus a 15.5% peer average, California is the pool's largest state exposure and the most elevated relative to peers. New York is roughly in line at 18.8% versus 18.0%. Texas (12.2% versus 9.0%), Pennsylvania (7.4% versus 1.1%) and Florida (7.2% versus 2.7%) are above peer averages, with Pennsylvania's deviation particularly notable.
State Allocations
| State | BANK5 2026-5YR23 | Comparable Deals | BANK5 2026-5YR22 | BBCMS 2026-5C42 | WFCM 2026-5C10 | BMO 2026-5C15 |
|---|---|---|---|---|---|---|
| CA | 25.4% | 15.5% | 24.1% | 14.3% | 13.1% | 10.6% |
| NY | 18.8% | 18.0% | 0.4% | 16.4% | 15.4% | 39.9% |
| TX | 12.2% | 9.0% | 8.5% | 11.2% | 10.3% | 6.2% |
| PA | 7.4% | 1.1% | 0.1% | 0.0% | 4.1% | 0.1% |
| FL | 7.2% | 2.7% | 3.3% | 4.0% | 0.0% | 3.3% |
| NJ | 5.2% | 6.6% | 2.9% | 9.5% | 2.8% | 11.3% |
| MN | 3.6% | 0.0% | 0.0% | 0.0% | 0.0% | 0.0% |
| Top 3 States | 56.5% | 52.9% | 59.9% | 44.8% | 45.0% | 61.9% |
-
Loan count and concentration metrics are a relative bright spot: Top-10 loan concentration of 55.7% is below the 64.3% peer average, and the effective loan count of 22.6 versus 18.7 for peers indicates better granularity — a partial offset to the property-type and geographic concentrations.
-
Leverage and coverage metrics are broadly weaker than peers: WA balloon LTV of 49.3% compares to a 42.8% peer average; the share of loans with DSCR below 1.25x is 14.6% versus 5.4% for peers; and the share with debt yield below 8.0% is 13.4% versus 4.7%. Together, these measures represent a pool that is, on balance, more leveraged and less covered than the comp set.
-
Sponsor equity is negligible: Cash equity of 0.9% versus a 5.1% peer average is the most noticeable single-metric divergence in the credit profile, leaving less sponsor skin-in-the-game as a loss buffer.
-
Full-term IO share amplifies balloon risk: At 95.2% versus an 86.8% peer average, the pool is overwhelmingly interest-only for its full term, which helps explain this deal's higher weighted average balloon LTV of 49.3%.
Credit Metrics
| Metric | BANK5 2026-5YR23 | Comparable Deals | BANK5 2026-5YR22 | BBCMS 2026-5C42 | WFCM 2026-5C10 | BMO 2026-5C15 |
|---|---|---|---|---|---|---|
| Top 10 Loans Share of Deal | 55.7% | 64.3% | 67.7% | 56.0% | 67.9% | 65.7% |
| Largest Sponsor Share of Deal | 7.7% | 10.4% | 10.0% | 9.6% | 9.2% | 12.9% |
| Effective Loan Count | 22.6 | 18.7 | 17.4 | 22.1 | 17.6 | 17.6 |
| Full Term IO Share of Deal | 95.2% | 86.8% | 95.9% | 74.1% | 81.3% | 96.0% |
| Partial IO Share of Deal | 0.0% | 3.4% | 2.7% | 10.8% | 0.0% | 0.0% |
| Wtd Avg Balloon LTV | 49.3% | 42.8% | 43.5% | 43.3% | 53.8% | 30.7% |
| Wtd Avg Subordinated Debt Gap Pct Share of Deal | 0.3% | 1.0% | 0.7% | 0.0% | 0.8% | 2.6% |
| Non-Controlling Share of Deal | 25.5% | 21.0% | 20.9% | 12.9% | 14.6% | 35.7% |
| DSCR Under 1.25 Share of Deal | 14.6% | 5.4% | 0.0% | 1.2% | 12.6% | 7.7% |
| Occupancy Under 80 Pct Share of Deal | 12.0% | 12.5% | 25.5% | 14.8% | 6.7% | 3.2% |
| Debt Yield Under 8 Pct Share of Deal | 13.4% | 4.7% | 11.1% | 0.0% | 7.8% | 0.0% |
| Sponsor Cash Equity Pct, Share of Deal | 0.9% | 5.1% | 3.4% | 5.4% | 3.8% | 7.7% |
| Tenant Roll Risk Share of Deal | 0.0% | 4.3% | 0.0% | 4.4% | 0.0% | 12.6% |
Loan-level Review
Three loans warranted a closer look.
-
Loan 2 (Southeast MHP Portfolio): A 37-property manufactured housing portfolio with a strong NOI growth trajectory provides the core mitigant, but the loan is a cash-out refinance with no new sponsor equity, full-term IO at a whole-loan LTV that persists to maturity, and underwriting that embeds material lease-up assumptions not yet reflected in trailing income. Several individual properties sit well below the portfolio's average occupancy, and the gap between underwritten gross potential rent and trailing effective gross income is substantial. The DSCR cash-sweep trigger sits only 16 basis points below the current underwritten coverage ratio, leaving limited headroom before protections engage.
-
Loan 6 (Inwood Living): A newly constructed mixed-use residential/retail property in an Upper Manhattan submarket (Inwood) with 94.5% physical occupancy, but underwritten NOI that is 51% above trailing annualized NOI and depends on multiple unproven income streams — vacant units with forward move-in dates, retail tenants still in buildout or not yet delivered, a parking lease with no third-party tenants at origination, and a 421-a tax abatement not yet reflected in issued tax bills. A near-term binary risk exists in the form of a retail tenant termination option that could be exercised at or just after origination; a reserve covers one year of lost rent but not the full long-term income stream.
-
Loan 9 (Marriott Tampa Westshore): A full-service hotel with a consistently improving NOI trajectory and conservative underwriting set exactly at trailing actuals — a meaningful mitigant — but occupancy has trended downward over the past two years and the property has lost modest competitive-set penetration, with no specific recovery catalyst disclosed beyond a fully escrowed property improvement plan required by mid-2027. The headline LTV of 50.0% is stated on a hypothetical upon-completion appraisal basis; the as-is LTV is higher at 56.6%. A ground lease whose primary term expires before loan maturity introduces structural complexity, partially mitigated by extension options and lender direct-lease rights but not fully resolved. The current underwritten NCF DSCR of 1.84x provides 59 basis points of cushion above the cash trap trigger at 1.25x NCF DSCR.
Structure, Governance, and Relative Value
-
Senior classes (A-1, A-2, A-3) are priced in line with peers: All three senior classes carry 30.00% credit support, in line with the peer average. A-1 spreads at an estimated 70 bps (0.77 bps wide of peers), A-2 at 78 bps (3.50 bps wide of peers), and A-3 at 80 bps (essentially flat to peers at +0.25 bps). The spread differentials are not material at this level of the stack, and the classes are well-insulated from the pool's credit concerns under both stress scenarios.
-
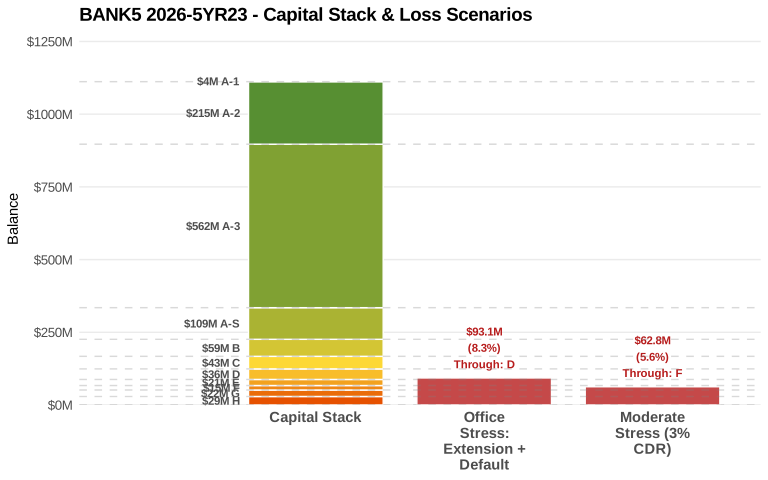
A-S carries the most significant structural and rating complexity in the stack: Credit support of 20.25% is slightly thinner than the 20.53% peer average, and the spread of 125 bps is 13 bps wide of the 112 bps peer average — the widest in the comp set. More consequentially, Moody's rates A-S at A1(sf) while Fitch and DBRS assign AAA(sf), a four-notch divergence that is material for mandate-constrained investors. Accounts requiring universal AAA will be excluded; those accepting the highest rating from any two agencies may qualify. The 13 bps spread premium may only partially compensate for this rating uncertainty, and investors should assess whether the Moody's view is the binding constraint for their mandate. Financialyst's stress results show A-S is money-good in both scenarios (below) with 11.9 percentage points of headroom in the office stress and 14.6 percentage points in the moderate stress, supporting the view that the subordination gap is not a material risk at this level — but the rating split is a separate, non-trivial consideration.
-
B prices with a modest spread premium over thin subordination: Credit support of 15.00% is 44 basis points below the 15.44% peer average, and the spread of 145 bps is 10 bps wide of the 135 bps peer average. Stress results show B is money-good in both scenarios with 6.7 percentage points of headroom in the office stress and 9.4 points in the moderate stress — comfortable buffers. The spread premium partially compensates for the thinner cushion, and the stress resilience supports the quality read.
-
C is the most notable relative-value caution in the rated stack: Credit support of 11.12% is 44 basis points lower than the 11.56% peer average, yet C prices essentially flat to peers at 195 bps (1.25 bps wide of the 193.75 bps peer average). This same-spread/thin-cushion combination means investors receive no meaningful compensation for the subordination deficit. C is money-good in both stress scenarios, but its office-stress headroom of 2.77 percentage points is the tightest of any money-good rated class — further deterioration in the office book beyond scenario assumptions would compress this buffer rapidly.
-
X-B carries a modest one-notch split rating: Fitch rates X-B at A-sf and DBRS at A(sf); both agencies remain in the single-A range, and the practical impact on investor eligibility is limited. X-B's relative value is driven primarily by prepayment and extension assumptions rather than credit subordination.
-
D and below are directional bets on office performance: D is partially impaired in the office stress (-0.47 percentage points) and money-good but thin in the moderate stress (+2.25 points); investors in D are effectively taking a view on the office sector outlook. E survives the moderate stress with only 0.37 points of headroom and is fully written down in the office stress — a high-conviction directional position.
Deal Structure and Pricing
| Class | BANK5 2026-5YR23 Credit Support | Comparable CS | CS (bps) | BANK5 2026-5YR23 Spread | Comparable Spread | Spread (bps) | Split |
|---|---|---|---|---|---|---|---|
| A-1 | 30.00% | 30.00% | 0 | +70 * | +69.23 | 1 | — |
| A-2 | 30.00% | 30.00% | 0 | +78 | +74.50 | 4 | — |
| A-3 | 30.00% | 30.00% | 0 | +80 | +79.75 | 0 | — |
| A-S | 20.25% | 20.53% | -28 | +125 | +112.00 | 13 | 4-notch |
| B | 15.00% | 15.44% | -44 | +145 | +135.00 | 10 | — |
| C | 11.12% | 11.56% | -44 | +195 | +193.75 | 1 | — |
* Financialyst estimate for A‑1 class spread.
Stress Resilience
We ran the deal through Financialyst's Cash Flow Engine, using two scenarios to test bond-level performance under stress. The first was an office-specific shock, designed with the deal's higher exposure to office in mind. This scenario applies 24-month extensions and elevated post-maturity default rates to office loans at 40% loss severity. The second was our standard "moderate distress" scenario, which applies a 3% annual default rate across the entire portfolio.
-
The office stress is the binding scenario. Our loan-level office stress produces a cumulative pool loss of 8.35% and pushes first loss to Class D, which is partially impaired at -0.47 percentage points of headroom. All placed rated classes remain money-good: A-1/A-2/A-3 with 21.65 points of headroom, A-S with 11.90 points, B with 6.65 points, and C with 2.77 points — the tightest of any money-good rated class, consistent with its thin-cushion caution. Classes E through H are fully written down in the office stress scenario.
-
The moderate pool-wide stress is less severe for the rated stack. The moderate stress scenario yields a 5.63% cumulative pool loss with first loss at Class F (-1.01 percentage points). The placed classes are comfortably money-good — A-1/A-2/A-3 at 24.37 points, A-S at 14.62 points, B at 9.37 points, C at 5.49 points — while D survives with 2.25 points and E with a thin 0.37 point. That the sector-specific stress is materially harsher than the broad economic stress confirms office concentration as the deal's primary structural risk driver.
-
Below-C classes are directional office bets. D is partially impaired in the office stress and thin in the moderate scenario; E is effectively at the margin of money-good in the moderate stress and fully written down in the office stress. Investors in these classes could be viewed as taking a high-conviction position on the office sector outlook.
-
Scenario granularity matters here. These results come from Financialyst's cashflow model, which supports bespoke scenarios — such as the office extension-and-default stress above — rather than being limited to standardized pool-wide CDR runs. For a deal whose risk is concentrated in a single property type, that granularity is, in our view, essential to seeing where losses actually land.
Conclusion
BANK5 2026-5YR23 is a deal where headline diversification tries to balance softer credit metrics: a pronounced office overweight, a low-DSCR and low-debt-yield tail, near-total full-term IO, and almost no sponsor cash equity. The loan-level reviews reinforce the theme — each of the three exposures examined rests to some degree on income that has not yet been demonstrated, whether through lease-up, tax-abatement execution, or a hotel repositioning. The office concentration flows through directly to the capital stack: the office stress scenario lands first loss at Class D and compresses Class C's headroom to 2.77 percentage points, the tightest among money-good rated classes. We view the seniors as priced in-line with other recent deals, and A-S and B as carrying spread premiums that broadly acknowledge their thinner-than-peer subordination — though A-S buyers must weigh the four-notch Moody's split. Class C, printing flat to peers despite subordination 44 bps below the peer average and a slim stress buffer, is where investors might want more compensation; further deterioration in the office book beyond our scenario assumptions would compress that buffer rapidly. Classes D and below can be viewed as a directional position on office market recovery as much as a structured-credit investment.
Important Disclaimers & Disclosures
Nature of Content: This publication is for informational purposes only and is intended solely for sophisticated institutional investors. The content herein, including credit analyses, relative value assessments, and structural reviews, constitutes statements of opinion as of the date of publication and not statements of fact regarding creditworthiness or investment potential. Nothing contained in this report constitutes investment advice, a recommendation, or an offer to sell or a solicitation of an offer to buy any securities. This report does not take into account the particular investment objectives, financial situations, or needs of individual investors.
Data Integrity & Sources: The data and information contained herein are derived from the Preliminary Prospectus and other sources believed by Financialyst, Inc. to be reliable. However, Financialyst, Inc. has not performed an independent audit or verification of the underlying collateral data (including Annex A data tapes). This information is provided on an "as-is" basis and is subject to amendment or supplementation. Financialyst, Inc. makes no representation or warranty, express or implied, regarding the accuracy, timeliness, completeness, merchantability, or fitness for a particular purpose of any such information.
Limitation of Liability: Financialyst, Inc. and its directors, officers, employees, and agents specifically disclaim any and all liability for any errors, omissions, or delays in the data or analysis, or for any actions taken in reliance thereon. In no event shall Financialyst, Inc. be liable for any direct, indirect, incidental, special, or consequential damages arising out of the use of, or inability to use, this report or the information contained herein, even if advised of the possibility of such damages.
Forward-Looking Statements: This report may contain forward-looking statements regarding future market conditions, lease expirations, or asset performance. These statements are based on current assumptions and are subject to risks and uncertainties; actual results may differ materially. Financialyst, Inc. assumes no obligation to update any information or opinions contained herein.
Copyright: © 2026 Financialyst, Inc. All Rights Reserved. This publication may not be reproduced, retransmitted, or distributed in any form without the prior written consent of Financialyst, Inc.