
- BANK 2026-BNK52 presents a collateral profile marked by elevated hospitality and multifamily concentrations, a pronounced New York tilt, and an above-average exposure to loans with occupancy under 80%.
- The pool's credit metrics offer partial offsets—lower top-ten concentration, higher effective loan count, and lower balloon LTV — yet the structure delivers thinner subordination at the mezzanine (B and C) classes while pricing flat to tighter.
- Stress scenarios validate the market's quality view for the senior stack—AAA classes retain 7 to 23 percentage points of headroom—but expose the mezzanine's thin cushion: class C is breached in the moderate stress and survives the hospitality shock with only 2.35 percentage points of headroom, while class B retains 2.67 points in the moderate scenario.
- The deal offers relative value for investors underwriting to collateral quality and split-rating upside, but mezzanine buyers assume narrower structural protection than the peer set.
Four recent 10-year deals were selected for comparison: BMO 2026-C14, BMARK 2026-B42, WFCM 2026-C66 and BMARK 2026-B43.
Financialyst's Cash Flow Engine was used to analyze two stress scenarios and their impact on bond performance.
Composition and Credit
- Property-type concentrations favor multifamily and hospitality.
- Geographic concentration tilts heavily to New York and California.
- Credit metrics show lower concentration and balloon leverage, but elevated low-occupancy exposure.
Property-type Concentrations
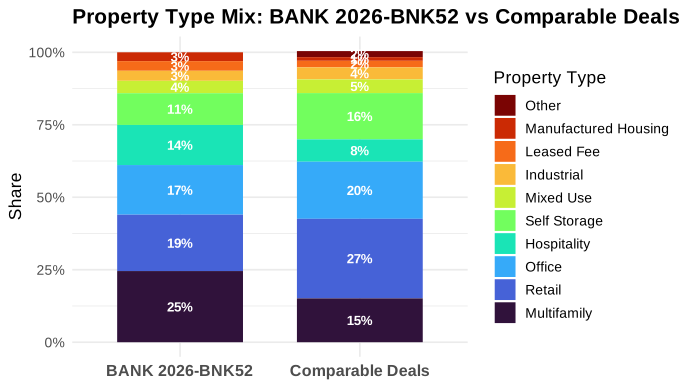
- The pool is overweight multifamily (24.5% versus 15.1% peer average) and hospitality (13.8% versus 7.7%), and underweight retail (19.5% versus 27.5%) and self-storage (11.0% versus 16.0%).
- Office exposure is slightly below peers at 17.1% versus 19.7%.
- The hospitality concentration—comprising the Marriott Anchorage, Courtyard Bellevue, and Sheraton Denver ground-lease assets—becomes the focal point of the loan-level stress scenario.
Geographic Concentration
- New York represents 36.2% of the pool versus 20.7% peer average, driven in part by the top loan, a Manhattan office anchored by diplomatic and sovereign tenants.
- California is also elevated at 14.1% versus 9.2%, and Washington state is an outlier at 7.2% versus 0.2% peer average.
- The pool has no exposure to several states present in peers, including Massachusetts, Michigan, Ohio, and Pennsylvania.
State Allocations
| State | BANK 2026-BNK52 | Comparable Deals | BMO 2026-C14 | BMARK 2026-B42 | WFCM 2026-C66 | BMARK 2026-B43 |
|---|---|---|---|---|---|---|
| NY | 36.2% | 20.7% | 15.8% | 35.2% | 11.6% | 20.2% |
| CA | 14.1% | 9.2% | 6.7% | 13.1% | 7.6% | 9.2% |
| WA | 7.2% | 0.2% | 0.4% | 0.0% | 0.2% | 0.0% |
| AK | 6.6% | 2.9% | 0.7% | 0.1% | 8.7% | 2.2% |
| VA | 6.2% | 11.6% | 13.1% | 1.6% | 18.3% | 13.6% |
| FL | 6.1% | 5.6% | 8.9% | 4.4% | 8.2% | 1.1% |
| TX | 5.1% | 5.5% | 9.6% | 4.7% | 4.5% | 3.3% |
| Top 3 States | 57.6% | 45.2% | 39.7% | 59.3% | 38.6% | 43.0% |
Credit Metrics
- Top-ten concentration is lower than peers (57.1% versus 62.2%), and effective loan count is higher (23.7 versus 20.5), both indicating greater diversification.
- Weighted average balloon LTV is lower at 33.3% versus 37.0%, and the pool carries no loans with debt yield under 8% (0.0% versus 1.3% peer average) or DSCR under 1.25x (0.4% versus 4.1%).
- The share of loans with occupancy under 80% is a significant outlier at 33.2% versus 8.3% peer average, reflecting near-term lease-up risk concentrated in the top loan.
- The pool also carries a 1.38% subordinated debt gap (peers 0.0%) and slightly elevated full-term IO share (63.9% versus 62.0%). Tenant roll risk is absent at 0.0% versus 13.2% peer average.
Credit Metrics
| Metric | BANK 2026-BNK52 | Comparable Deals | BMO 2026-C14 | BMARK 2026-B42 | WFCM 2026-C66 | BMARK 2026-B43 |
|---|---|---|---|---|---|---|
| Top 10 Loans Share of Deal | 57.1% | 62.2% | 67.6% | 50.6% | 67.0% | 63.5% |
| Largest Sponsor Share of Deal | 10.0% | 10.3% | 11.6% | 10.1% | 9.9% | 9.8% |
| Effective Loan Count | 23.7 | 20.5 | 17.6 | 27 | 17.4 | 20 |
| Full Term IO Share of Deal | 63.9% | 62.0% | 56.1% | 67.3% | 63.6% | 61.0% |
| Partial IO Share of Deal | 10.4% | 12.5% | 19.9% | 10.1% | 11.5% | 8.4% |
| Wtd Avg Balloon LTV Share of Deal | 33.3% | 37.0% | 38.0% | 36.3% | 32.7% | 40.8% |
| Wtd Avg Subordinated Debt Gap Pct Share of Deal | 1.4% | 0.0% | 0.0% | 0.0% | 0.0% | 0.0% |
| Non-Controlling Share of Deal | 20.3% | 24.0% | 23.7% | 21.6% | 33.0% | 17.7% |
| DSCR Under 1.25 Share of Deal | 0.4% | 4.1% | 0.0% | 2.5% | 0.0% | 13.8% |
| Occupancy Under 80 Pct Share of Deal | 33.2% | 8.3% | 10.2% | 4.8% | 9.9% | 8.3% |
| Debt Yield Under 8 Pct Share of Deal | 0.0% | 1.3% | 0.0% | 0.0% | 0.0% | 5.0% |
| Sponsor Cash Equity Pct, Share of Deal | 10.9% | 9.4% | 11.7% | 14.3% | 7.0% | 4.4% |
| Tenant Roll Risk Share of Deal | 0.0% | 13.2% | 52.8% | 0.0% | 0.0% | 0.0% |
Loan-level Review
Loan 1, One Dag (Manhattan office, diplomatic tenants): exceptional tenant quality tempered by near-term vacancy and geopolitical rollover risk. The 29.6% vacancy (excluding the already-departing Sloan Kettering) represents substantial lease-up risk in a challenged Manhattan office market, and the 2031 rollover of The United Nations (13.8% NRA) with early termination options starting 2029, combined with diplomatic termination rights held by Germany, France, the UK, and others, creates unusual concentration and geopolitical risk. The total debt NCF DSCR of 1.03x without the Sweden/Chile renewals indicates a thin cushion at the 74.3% total LTV. Risk mitigants include an exceptionally high-quality tenant base—political and diplomatic tenants occupy 82.5% of occupied space with 17.6 years weighted average tenure—and recent leasing momentum with approximately 169,949 SF (20.8% of NRA) executed since May 2024, plus two flagship retail tenants leased through 2041, indicating market acceptance despite broader office challenges.
Loan 8, NOVA Retail 2-Pack (anchored retail portfolio): strong operational trajectory and tenant quality, but aggressive leverage. The 1.39x DSCR provides only 39 basis points of cushion, and the 8.6% debt yield offers limited protection in a stress scenario. The $15.8 million equity distribution at closing suggests refinance-driven leverage optimization rather than conservative capitalization, and rollover of major anchors (Giant, Safeway, Lifetime) in 2030–2033 will be critical to sustained performance. Mitigants include strong operational momentum—NOI grew from $12.6 million (2024) to $14.1 million (2025), a 12% increase, driven by eight newly executed triple-net leases accounting for 4.4% of NRA—and exceptional tenant quality and stability: 32 national retailers, 12 investment-grade tenants, weighted average tenant tenure of 24.7 years, and 97.4% physical occupancy as of year-end 2025. However, the core leverage metrics remain unchanged: 70.3% LTV, 1.39x NCF DSCR, and 8.6% NCF debt yield are materially below typical anchored retail norms (60–65% LTV, 1.50x+ DSCR, 10%+ DY), and the equity distribution at closing extracted significant proceeds, leaving minimal equity cushion despite strong operations.
Loan 9, Sheraton Denver Downtown Hotel (Denver ground-lease hotel): exceptional term and institutional sponsorship, but unrated tenant and tight leverage. The tenant (Denver HS-EF Court Place, LLC) carries no credit rating (NR/NR/NR), leaving unquantified counterparty risk despite strong sponsor pedigree, and the 76.6% LTV and 1.29x DSCR remain tight with no cushion if the hotel operating performance deteriorates and the tenant cannot meet ground rent obligations. The leased-fee structure means the lender has no direct control over hotel operations or asset quality, and while springing cash management triggers at 1.05x DSCR for two quarters, this provides limited early-warning protection. Risk mitigants include a 99-year triple-net ground lease expiring in 2114 with no termination options, and contractual rent escalations of the lesser of CPI or 4% annually, with underwritten rent reflecting conservative 2% annual steps. The hotel underwent an $80 million renovation in 2021 and the property benefits from a prime Denver CBD location with proximity to the Colorado Convention Center. The ground lessee has purchase options at the 20th and 30th lease years with strike prices calculated at a value substantially above the $180 million whole loan balance, providing structural protection.
Structure, Governance, and Relative Value
Senior AAA classes offer market-level subordination at modest pricing concessions. The senior AAA classes carry 30% credit support, in line with typical conduit structuring. The A-1 prices at +70 basis points versus a +77 basis point peer mean—7 basis points tighter. A-4 and A-5 price 3 basis points tighter, while A-SB prices 1 basis point tighter. These classes offer straightforward value propositions: peer-level structural protection at marginally tighter pricing, consistent with stable AAA-rated demand.
A-S delivers thinner subordination at a flat spread, rewarding collateral quality. A-S carries 17.12% credit support versus a 20.72% peer average—359 basis points less subordination—yet prices at +100 basis points versus a +101 basis point peer mean, effectively flat. From the investor's perspective, this is less structural protection for the same compensation. From the market's perspective, the market accepts the thinner cushion at the same spread, implying it underwrites the deal's collateral as warranting less credit enhancement for the AAA rating—a reward for collateral quality. The stress results (see Stress Resilience below) support the market view: A-S remains comfortably money-good in both scenarios, with 10.09 percentage points of headroom in the hospitality shock (7.03% cumulative loss) and 7.04 percentage points in the moderate stress (10.08% cumulative loss), validating the lower enhancement.
Class B offers split-rating upside but carries thinner subordination. B carries 12.75% credit support versus a 15.69% peer average—294 basis points less subordination—and prices at +120 basis points versus a +133 basis point peer mean, 13 basis points tighter. From the investor's perspective, this is materially less structural protection at a tighter spread—a less favorable risk-reward profile. From the market's perspective, the market accepts the thinner cushion at a tighter spread, implying it underwrites the deal's collateral as warranting less credit enhancement for the rating. The stress results (see below) lean toward the market/quality reading: B remains money-good in both stress scenarios, with 5.72 percentage points of headroom in the hospitality shock and 2.67 percentage points in the moderate stress, though the moderate-stress cushion is narrow. The class is also split-rated: S&P AAA(sf), Fitch AA-sf, DBRS AA(sf)—a three-notch divergence—offering investors the opportunity to buy at an AA-/AA price while capturing S&P's AAA view if they underwrite to the higher rating.
Class C is breached in the moderate stress despite split-rating opportunity. C carries 9.38% credit support versus an 11.78% peer average—241 basis points less subordination—and prices at +175 basis points versus a +185 basis point peer mean, 10 basis points tighter. From the investor's perspective, this is less structural protection at a tighter spread. From the market's perspective, the market accepts the thinner cushion at a tighter spread, implying it underwrites the deal's collateral as warranting less credit enhancement for the rating. However, the stress results (see below) lean toward the thin-cushion-as-risk reading: C is breached in the moderate stress scenario (10.08% cumulative loss versus 9.38% credit support, -0.70 percentage points of headroom) and survives the hospitality shock with only 2.35 percentage points of headroom. The class is also split-rated: Fitch A-sf, DBRS A(sf) (S&P NR)—a one-notch divergence—offering investors the opportunity to buy at an A-/A price while capturing the higher rating if they underwrite to DBRS's A(sf) view. However, the split-rating opportunity must be weighed against the thin structural cushion.
Capital Stack and Pricing
| Class | BANK 2026-BNK52 Credit Support | Comparable CS | CS (bps) | BANK 2026-BNK52 Spread | Comparable Spread | Spread (bps) | Split |
|---|---|---|---|---|---|---|---|
| A-1 | 30.00% | 30.00% | 0 | +70 | +77.00 | -7 | — |
| A-SB | 30.00% | 30.00% | 0 | +75 | +75.75 | -1 | — |
| A-4 | 30.00% | 30.00% | 0 | +73 | +76.25 | -3 | — |
| A-5 | 30.00% | 30.00% | 0 | +75 | +78.25 | -3 | — |
| A-S | 17.12% | 20.72% | -359 | +100 | +101.25 | -1 | — |
| B | 12.75% | 15.69% | -294 | +120 | +133.33 | -13 | 3-notch |
| C | 9.38% | 11.78% | -241 | +175 | +185.00 | -10 | 1-notch |
Stress Resilience
We ran the deal through Financialyst's Cash Flow Engine, using two scenarios to test bond-level performance under stress. The first was a lodging-specific shock, designed with the deal's higher exposure to hospitality in mind. The second was our standard "moderate distress" scenario, which applies a 3% default rate across the entire portfolio.
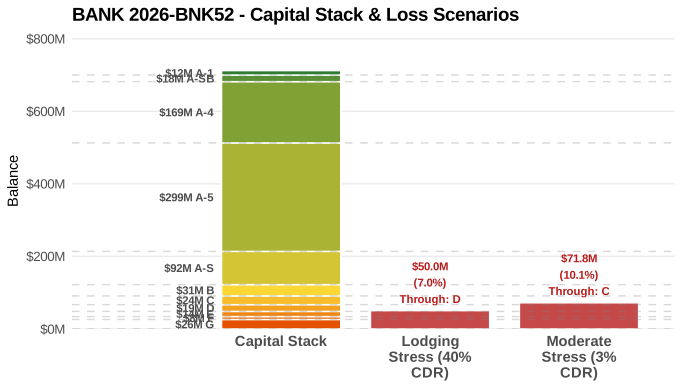
Hospitality demand shock produces a 7.03% cumulative loss, breaching class D but leaving all rated classes money-good. The deal's approximately 13% hospitality concentration—Marriott Anchorage, Courtyard Bellevue, and Sheraton Denver leased-fee—drives the losses. A broad lodging-sector recession applied a 40% annual CDR with loan-level severities of 40–50% to these three assets, producing a 7.03% cumulative pool loss (from a 15.48% cumulative default rate, realized severity 45.38%). First loss reaches class D (6.75% credit support, -0.28 percentage points of headroom). All rated, placed classes (A-1 through C) remain money-good. Class C, the lowest money-good rated class, retains 2.35 percentage points of headroom above the 7.03% loss, a narrow but positive cushion. Class B retains 5.72 percentage points of headroom, and the AAA-rated classes (A-1, A-SB, A-4, A-5, A-S) retain between 10.09 and 22.97 percentage points, demonstrating strong resilience to a severe sector-specific shock.
Moderate stress scenario produces a 10.08% cumulative loss, breaching class C and leaving B with a narrow cushion. This pool-wide stress does not target a specific collateral concern but rather tests the structure's resilience to a broad, moderate downturn across the entire portfolio. The moderate stress scenario applies a 3% annual CDR and 40% loss severity pool-wide, producing a 10.08% cumulative pool loss (from a 25.20% cumulative default rate, realized severity 40.00%). First loss reaches class C (9.38% credit support, -0.70 percentage points of headroom), which is breached. Class B, the lowest money-good rated class, retains 2.67 percentage points of headroom above the 10.08% loss—a narrow cushion that underscores the deal's thinner subordination relative to peers. The AAA-rated classes (A-1, A-SB, A-4, A-5, A-S) retain between 7.04 and 19.92 percentage points of headroom, remaining comfortably protected.
Stress results validate senior resilience but expose mezzanine vulnerability. The hospitality demand shock—a bespoke, loan-level scenario targeting the deal's approximately 13% hospitality concentration—demonstrates the Financialyst Cash Flow Engine's capability to run deal-specific risk assessments beyond standard pool-wide stresses. The AAA-rated classes retain substantial headroom in both scenarios (7 to 23 percentage points), supporting the market's acceptance of thinner subordination at A-S (359 basis points less than peers) as a reward for collateral quality. However, the mezzanine classes reveal the trade-off: class C is breached in the moderate stress and survives the hospitality shock with only 2.35 percentage points of headroom, while class B retains 2.67 percentage points in the moderate scenario—narrow cushions that underscore the deal's thinner subordination relative to peers (241 and 294 basis points less, respectively) and flag the structural risk despite the split-rating opportunities.
Conclusion
BANK 2026-BNK52 offers a study in trade-offs: elevated hospitality and multifamily concentrations, a pronounced New York tilt, and a 33.2% share of low-occupancy loans are balanced by lower top-ten concentration, higher effective loan count, and lower balloon leverage. Yet the structure delivers thinner subordination at the mezzanine classes while pricing flat to tighter than peers. The hospitality demand shock and moderate stress scenarios help validate the market's quality view for the senior stack, with AAA classes retaining 7 to 23 percentage points of headroom, but expose the mezzanine's thin cushion: class C is breached in the moderate stress and survives the hospitality shock with only 2.35 percentage points of headroom, while class B retains 2.67 points in the moderate scenario. The deal offers relative value for investors underwriting to collateral quality and split-rating upside—class B's three-notch divergence at a 13 basis point tighter spread, and class C's one-notch divergence at a 10 basis point tighter spread—but mezzanine buyers assume narrower structural protection than the peer set and must weigh the split-rating opportunity against the stress results. Senior buyers receive peer-level or better subordination at modest pricing concessions, a straightforward proposition; A-S buyers accept 359 basis points less subordination at a flat spread, rewarded by the deal's resilience in both scenarios. The deal is suited for investors who underwrite the collateral quality as warranting less enhancement and whose own outlooks on downside potential are no more severe than Financialyst's stress scenarios.
Important Disclaimers & Disclosures
Nature of Content: This publication is for informational purposes only and is intended solely for sophisticated institutional investors. The content herein, including credit analyses, relative value assessments, and structural reviews, constitutes statements of opinion as of the date of publication and not statements of fact regarding creditworthiness or investment potential. Nothing contained in this report constitutes investment advice, a recommendation, or an offer to sell or a solicitation of an offer to buy any securities. This report does not take into account the particular investment objectives, financial situations, or needs of individual investors.
Data Integrity & Sources: The data and information contained herein are derived from the Preliminary Prospectus and other sources believed by Financialyst, Inc. to be reliable. However, Financialyst, Inc. has not performed an independent audit or verification of the underlying collateral data (including Annex A data tapes). This information is provided on an "as-is" basis and is subject to amendment or supplementation. Financialyst, Inc. makes no representation or warranty, express or implied, regarding the accuracy, timeliness, completeness, merchantability, or fitness for a particular purpose of any such information.
Limitation of Liability: Financialyst, Inc. and its directors, officers, employees, and agents specifically disclaim any and all liability for any errors, omissions, or delays in the data or analysis, or for any actions taken in reliance thereon. In no event shall Financialyst, Inc. be liable for any direct, indirect, incidental, special, or consequential damages arising out of the use of, or inability to use, this report or the information contained herein, even if advised of the possibility of such damages.
Forward-Looking Statements: This report may contain forward-looking statements regarding future market conditions, lease expirations, or asset performance. These statements are based on current assumptions and are subject to risks and uncertainties; actual results may differ materially. Financialyst, Inc. assumes no obligation to update any information or opinions contained herein.
Copyright: © 2026 Financialyst, Inc. All Rights Reserved. This publication may not be reproduced, retransmitted, or distributed in any form without the prior written consent of Financialyst, Inc.